Need help? Ask the Autodesk Assistant!
The Assistant can help you find answers or contact an agent.
What level of support do you have?
Different subscription plans provide distinct categories of support. Find out the level of support for your plan.
Autodesk Support
May 13, 2022
[This page has been updated to work with Revit 2025. If you are interested in previous versions, i.e., Revit 2023&2024, you can download the pdf version of the training materials from here ]
Lesson 4: Debugging your code.
Learn how to use the Visual Studio debugger to step through your code line-by-line to follow the program execution; and to watch the values of variables as they are changed by your code.
It’s rare that you will write a program that runs perfectly the first time. Even if you haven’t made any mistakes that prevent Visual Studio from building your plug-in, it’s quite likely that you made a mistake in your program logic that causes it to produce different results from the ones you expected. Errors in your code are called bugs, and the process of stepping through your code examining the program execution flow and variable values is called debugging.
To debug your plug-in code, you’re going to have to launch Revit from your Visual Studio debugger and load your plug-in into Revit.
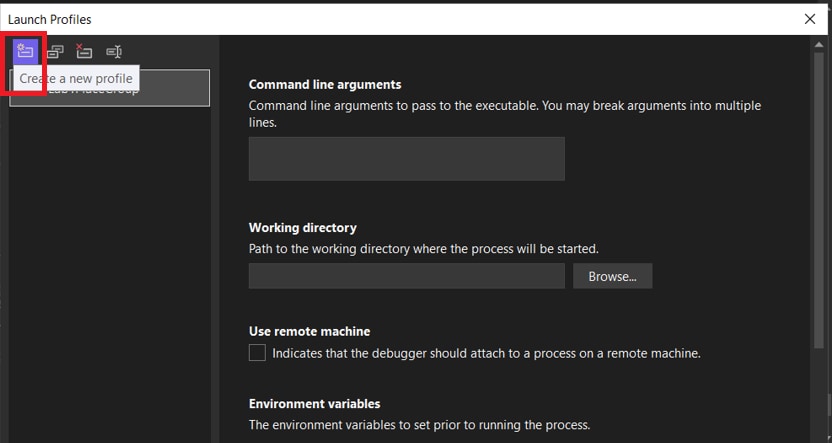
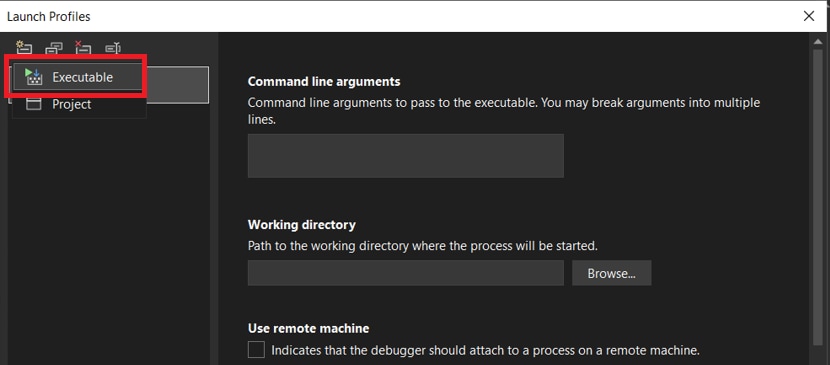
In order to be able to debug using Visual Studio, we have to make some manual edits to the project files by implementing the following steps:
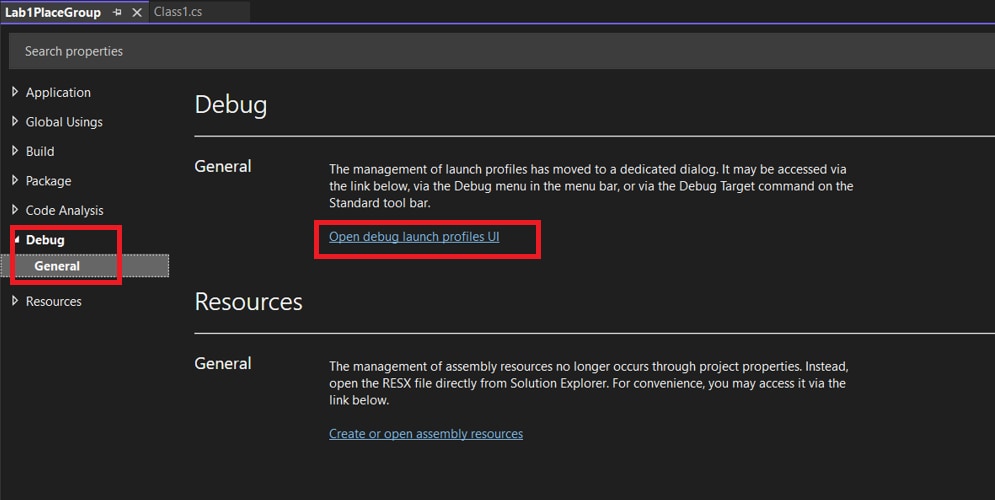
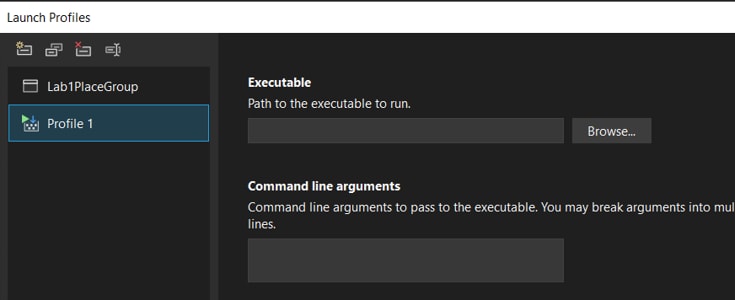
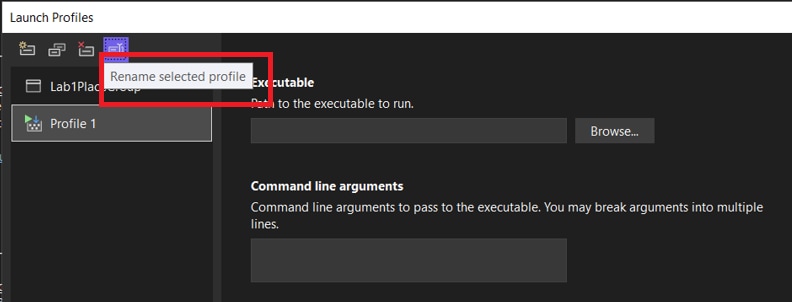
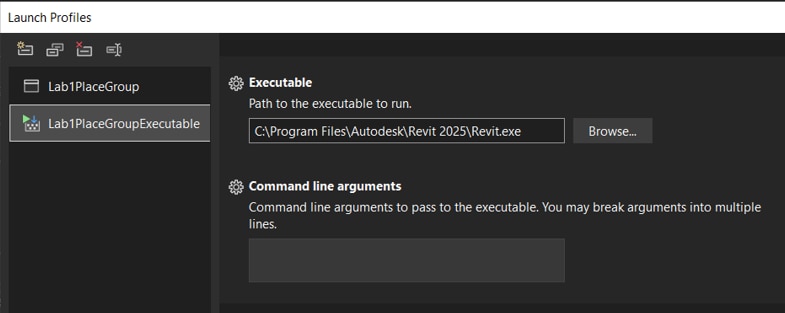
Launching the debugger
If you closed the Visual Studio, launch it again now and open the project you saved in Lesson 1 (called the Lab1PlaceGroup).
Before you launch the debugger, please ensure that the AddIn manifest file for this lab has been created and exists at the location described in the Writing an AddIn Manifest section in Lesson 1: The Basic Plug-in. Since you will now be debugging the plug-in code, you will be using ‘debug’ version of DLL. Visual Studio can create a ’debug’ version of your .NET plug-in DLL and ‘release’ version of dll. For Revit to read this ‘debug’ DLL, we need to change the path of the DLL in the manifest to match the location of DLL in < Assembly/ > (highlighted in bold below).
Note: If your default environment already created dll under /debug/ folder in Lesson 1, you can use the same location:
And so for Revit to read this ‘debug’ DLL instead of the ‘release’ DLL that was created in Lesson 1, we need to change the path of the DLL in the manifest to the following (highlighted in bold) –
<?xml version="1.0" encoding="utf-8"?>
<RevitAddIns>
  <AddIn Type="Command">
       <Name>Lab1PlaceGroup</Name>
       <FullClassName>Lab1PlaceGroup.Class1</FullClassName>
       <Text>Lab1PlaceGroup</Text>
       <Description>Places the Group at Particular Point</Description>
       <VisibilityMode>AlwaysVisible</VisibilityMode>
       <Assembly>C:\test\Lab1PlaceGroup\Lab1PlaceGroup\bin\Debug\net8.0\Lab1PlaceGroup.dll</Assembly>
       <AddInId>502fe383-2648-4e98-adf8-5e6047f9dc34</AddInId>
    <VendorId>ADSK</VendorId>
    <VendorDescription>Autodesk, Inc, www.autodesk.com</VendorDescription>
  </AddIn>
</RevitAddIns>
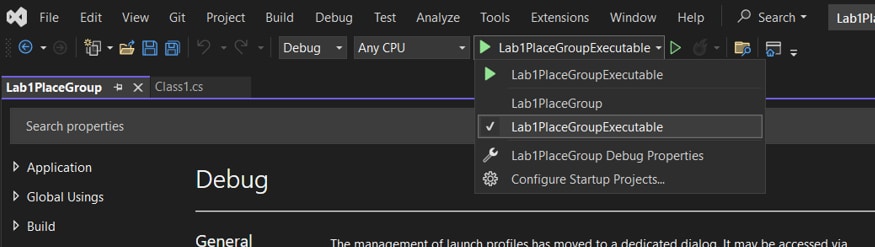
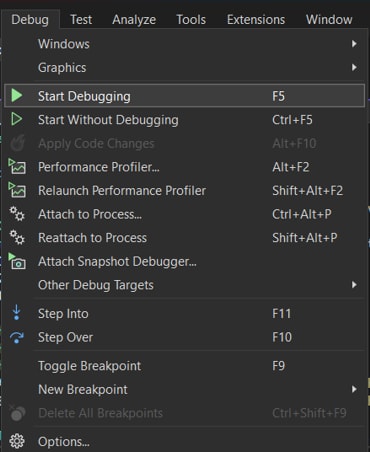
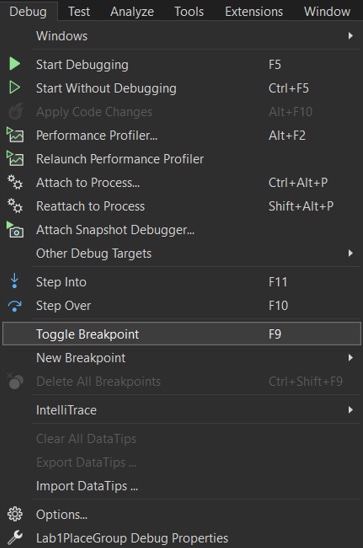
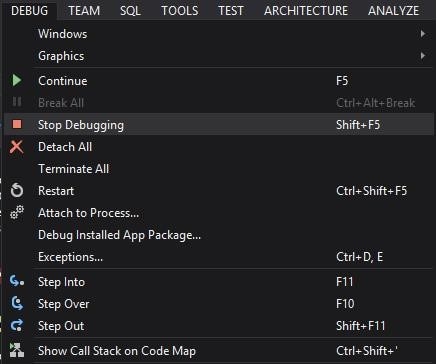
To start your debugging session, simply open the Debug menu and select the Start Debugging option, or just hit F5. This will launch Revit from your debugger.
You have to launch Revit in this way so that your debugger can hook into the Revit process to monitor the execution of the code you compiled into your plug-in DLL. Because we’ve placed the AddIn manifest in the correct location, Revit will automatically load our plug-in.
When you are building a ‘final’ version of your plug-in DLL that you want to give to your users and customers, Visual Studio will build a release version. Visual Studio makes various optimizations to the compiled code in a release build so that it will run faster and take up less memory. When you want to debug your code, Visual Studio will create a debug version of your plug-in DLL. The debug version isn’t optimized for speed/memory, and also includes additional information that the debugger uses to tell you about what is happening when the code runs.
Please read more on this in this article: How to: Attach to a Running Process
Now, open the Hotel.rvt Project file.
Breakpoints
Your plug-in DLL is now ready to debug. But before you run your Lab1PlaceGroup command, you have to tell the debugger you want it to stop when it is executing your code. You do this using a breakpoint.
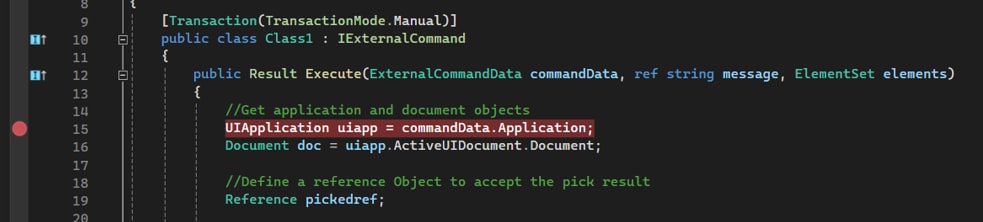
In Visual Studio, double-click on Class1.cs in the Solution Explorer to display your code and click anywhere in the line:
UIApplication uiapp = commandData.Application;Then select Toggle Breakpoint from the Debug menu (or hit F9).
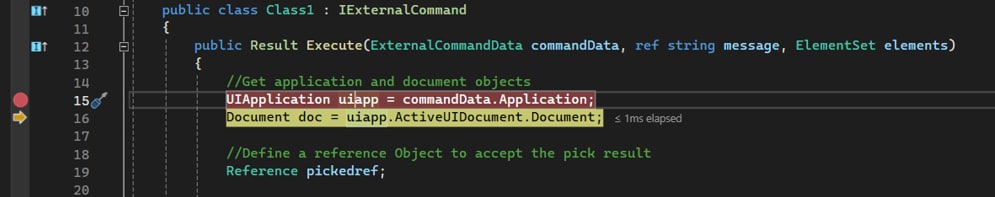
That line will now be highlighted in red and have a red circle (or a circle with a yellow warning sign if you haven’t run the command, yet) in the left margin next to it to indicate that you’ve set a breakpoint for this line:
Set a breakpoint for the PickPoint function in the same way:
//Pick point
   XYZ point = sel.PickPoint("Please pick a point to place group");
When Revit calls these methods in your code, the debugger will stop at these lines and wait for you to tell it what to do.
Stepping through your code
Now it’s time to invoke your command. Inside Revit on the Add-Ins ribbon tab, click the External Tools drop-down list, then click Lab1PlaceGroup.
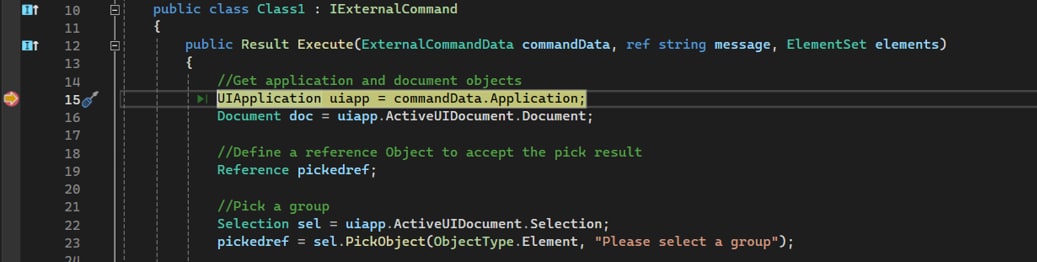
This will start your plug-in in Revit and Visual Studio should take control and become your foreground application. (If it doesn’t, click on its icon in your Windows taskbar to activate it.) The debugger is now stopped waiting for you with the line of code it’s about to execute highlighted in yellow and with a little yellow arrow in the margin next to it.
Now you’re ready to step through your code. The Visual Studio debug menu gives you three ways to step through your code: Step Into; Step Over; and Step Out. You’ll mostly be using Step Over – this executes the next line of code (the line highlighted in yellow) in the debugger, and then moves to the next line. If the line of code to be executed is a method call, then Step Over executes the entire method. If you also want to execute the called method a line at a time, you can use Step Into; and you can use Step Out to move back up (out of the method) to the code you were originally debugging.
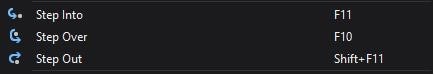
As well as in the Debug menu, you should also see Step Into, Step Over and Step Out icons on a toolbar, and each also has a corresponding hot key (F11, F10, and Shift+F11).
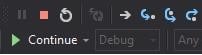
Click on the Step Over icon on the toolbar now. The debugger moves to the next line of code (it ignores comments).
You can now hover the mouse over the text uiapp and a tooltip is displayed showing the value of the variable.
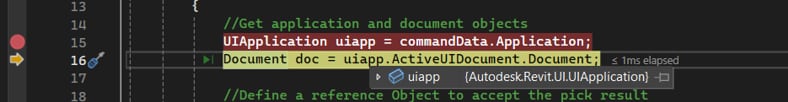
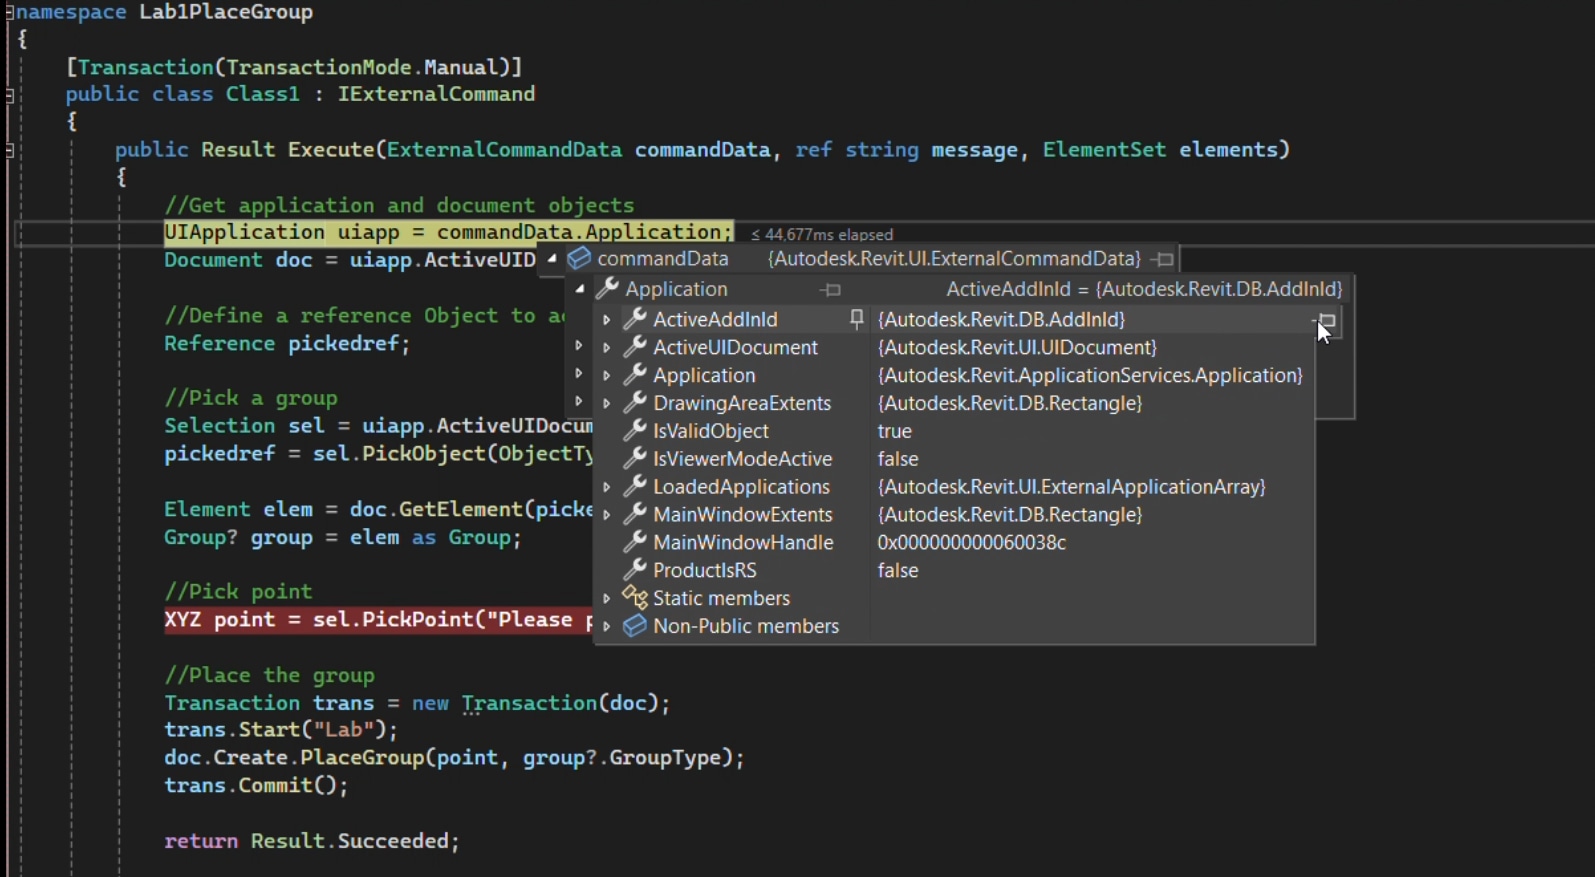
You can click on the sign to drill down to the various properties and check their values.
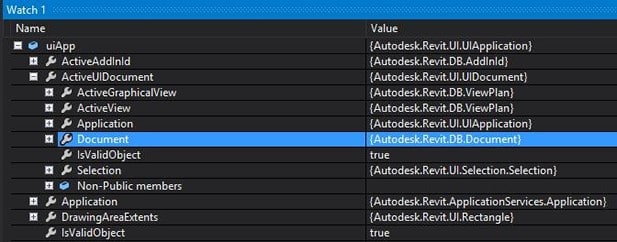
To display variable values, you can also right click on the variable in your code and select Add Watch. This displays the variable and its value in the Watch window at the bottom of your IDE.
Keep stepping through the code, hovering over variable values and properties to see how they change as the code executes. If at any point you want to stop line-by-line debugging, just hit F5 to Continue to the next breakpoint you had set – which in our case was set to the sel.PickPoint() line.
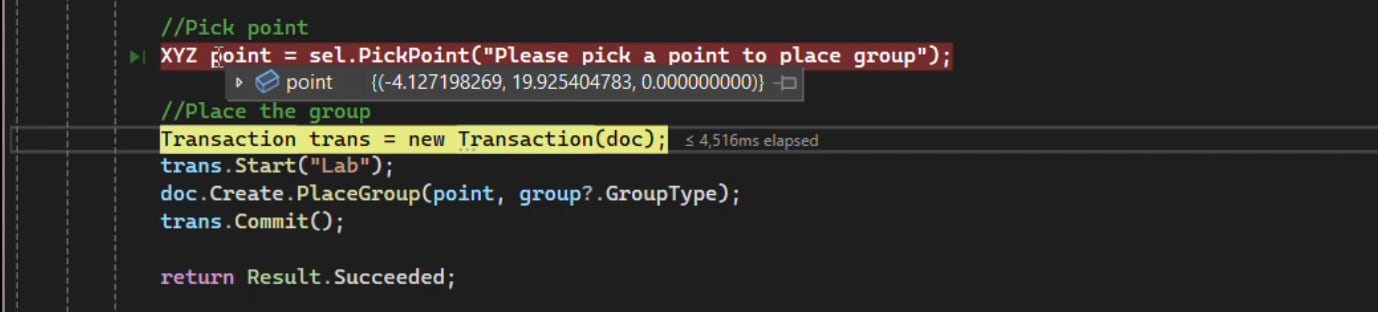
Stepping through this line by clicking F10, makes Revit the foreground application and prompts you to select the point where you want the Furniture group to be copied to. Let us select the approximate center of the adjacent room now. As soon as the point is selected, Visual Studio now becomes the foreground application with the next line of code highlighted in yellow with the debugger waiting for us to either check the value of the selected point or continue line by line debugging or just jump to the next breakpoint by clicking F5. At this point, we can check the XYZ value of the selected point by just hovering the mouse over the point variable (which is the container/variable we created to store the target point for the furniture group to be copied to).
If you hit F5 now, you will find that the debugger steps through all the remaining code, and makes Revit the foreground application again with the copy operation successfully completed.
Once you’ve finished experimenting, select Stop Debugging from the Debug menu to close Revit and end your debugging session.
Congratulations! You now know how to debug a project in Visual Studio.
Was this information helpful?
The Assistant can help you find answers or contact an agent.
What level of support do you have?
Different subscription plans provide distinct categories of support. Find out the level of support for your plan.