Need help? Ask the Autodesk Assistant!
The Assistant can help you find answers or contact an agent.
What level of support do you have?
Different subscription plans provide distinct categories of support. Find out the level of support for your plan.
Autodesk Support
Mar 31, 2023
|
Learn how to use the Visual Studio debugger to step through your code line-by-line to follow the program execution; and to watch the values of variables as they are changed by your code. |
Provide Feedback: Please provide feedback about this AutoCAD Training or this lesson via email: myfirstplugin@autodesk.com Lesson Downloads
| ||||

It’s rare that you will write a program that runs perfectly the first time. Even if you haven’t made any mistakes that prevent Visual Studio from building your plug-in, it’s quite likely that you made a mistake in your program logic that causes it to produce different results from the ones you expected. Errors in your code are called bugs, and the process of stepping through your code examining the program execution flow and variable values is called debugging.
To debug your plug-in code, you’re going to have to launch AutoCAD from your Visual Studio Community debugger and load your plug-in into AutoCAD*.
* If you are using the completed sample projects rather than starting from scratch from the steps we provide here, we assume that you have installed AutoCAD to the C:\Program Files\Autodesk\AutoCAD 20xx folder. If your installation location for AutoCAD is different from this, then to be able to debug the completed sample projects, you must follow these steps.
This is easy in the professional versions of Visual Studio – the My Project settings allow you to set the executable to launch when you start the debugger:
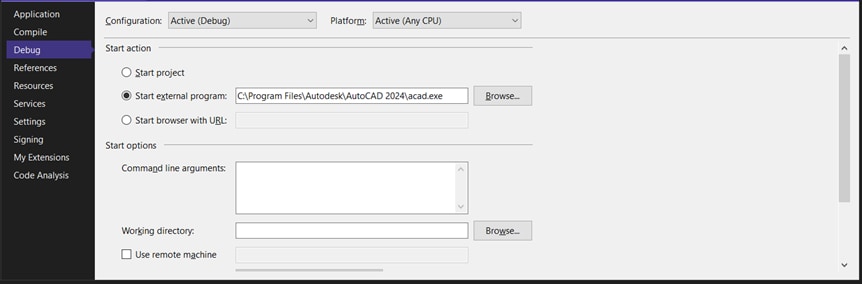
However, that functionality isn’t exposed through the Visual Studio Community IDE. This is why you created your project in Lesson 1 using the AutoCAD.NET Wizards, instead of creating it from first principles using the Class Library project. If you set the correct location for AutoCAD in the configuration dialog, then this setting will have been created for you even though you can’t change it through the Visual Studio Community user interface.
If for some reason, the project Wizard didn’t set this correctly, or you decided to use a Class Library project, you can manually set AutoCAD 20xx to be launched by the debugger by following these instructions.
Launching the debugger
If you closed the Visual Basic .NET IDE, launch it again now and open the project you saved in Lesson 1.
To start your debugging session, simply open the Debug menu and select the Start Debugging option, or just hit F5. This will launch AutoCAD 20xx from your debugger:
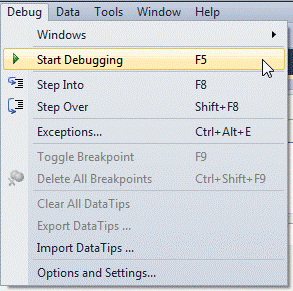
You have to launch AutoCAD in this way so that your debugger can hook into the AutoCAD process to monitor the execution of the code you compiled into your plug-in DLL.
If you have the Visual Studio Community Immediate window open when you do this, you will see a lot of text scrolling up that window. Some of that text looks a little scary because it includes the word ‘error’. Don’t worry about that. This text is informational only – it doesn’t mean there’s a problem with AutoCAD or with your plug-in.
Once AutoCAD is ready, load your plug-in using the NETLOAD command as you did in Lesson 1. However, because you’re now debugging, Visual Studio Community has created a ’debug’ version of your .NET plug-in DLL. If you saved your project to C:\test, then the path to load this from will be:
C:\test\KeepAttributesHorizontal\KeepAttributesHorizontal\bin\Debug\KeepAttributesHorizontal.dll
Remember that the DLL you loaded in Lesson 1 was in the bin\Release folder. When you are building a ‘final’ version of your plug-in DLL that you want to give to your users and customers, Visual Studio will build a release version. Visual Studio makes various optimizations to the compiled code in a release build so that it will run faster and take up less memory. When you want to debug your code, Visual Studio will create a debug version of your plug-in DLL. The debug version isn’t optimized for speed/memory, and also includes additional information that the debugger uses to tell you about what is happening when the code runs.
Now open the BlocksWithAttributes.dwg test drawing.
Breakpoints
Your plug-in DLL is now ready to debug. But before you run your KEEPSTRAIGHT command, you have to tell the debugger you want it to stop when it is executing your code. You do this using a breakpoint.
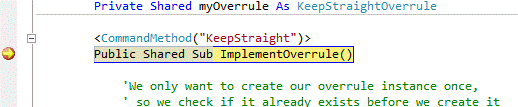
In Visual Studio Community, double-click on MyCommands.vb in the Solution Explorer to display your code and click anywhere in the line:
Public Shared Sub ImplementOverrule()
Then select Toggle Breakpoint from the Debug menu (or hit F9).
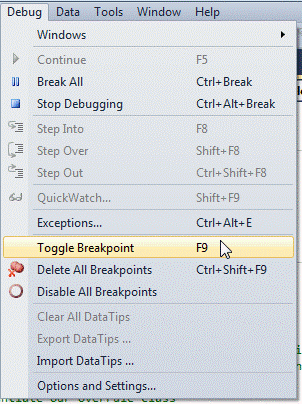
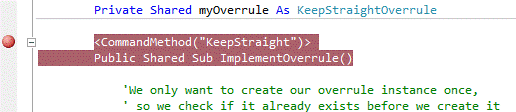
That line will now be highlighted in red and have a red circle in the margin next to it to indicate that you’ve set a breakpoint for this line:
Set a breakpoint for the TransformBy function in the same way:
Public Overrides Sub TransformBy(ByVal entity As Entity,

ByVal transform As Matrix3d)
When AutoCAD calls these methods in your code, the debugger will stop at these lines and wait for you to tell it what to do.
Stepping through your code
Now it’s time to invoke your command. Type KEEPSTRAIGHT followed by <Enter> at the AutoCAD command-line. Visual Studio Community should take control and become your foreground application. (If it doesn’t, click on its icon in your Windows taskbar to activate it.) The debugger is now stopped waiting for you with the line of code it’s about to execute highlighted in yellow and with a little yellow arrow in the margin next to it. The CommandMethod attribute is telling AutoCAD that it should run your ImplementOverrule() method when the user invokes the KEEPSTRAIGHT command, which is why the debugger has stopped at the breakpoint you set at the start of that method.
Now you’re ready to step through your code. The Visual Studio Community debug menu gives you three ways to step through your code: Step Into; Step Over; and Step Out. You’ll mostly be using Step Over – this executes the next line of code (the line highlighted in yellow) in the debugger, and then moves to the next line. If the line of code to be executed is a method call, then Step Over executes the entire method. If you also want to execute the called method a line at a time, you can use Step Into; and you can use Step Out to move back up (out of the method) to the code you were originally debugging.
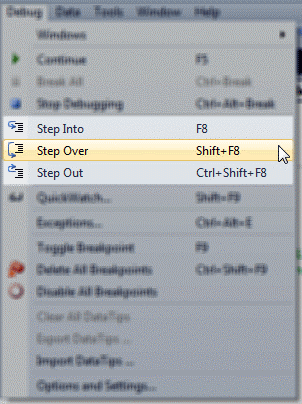
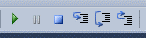
As well as in the Debug menu, you should also see Step Into, Step Over and Step Out icons on a toolbar, and each also has a corresponding hot key (F8, Shift+F8, and Ctrl+Shift+F8).
Click on the Step Over icon on the toolbar now. The debugger moves to the next line of code (it ignores comments).
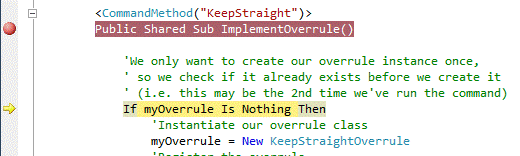
This line is the start of a conditional statement. The code between If…Then and End If is only executed if the logical condition between If and Then evaluates to True. Hover your mouse over the text myOverrule. A tooltip is displayed showing the value of the variable.
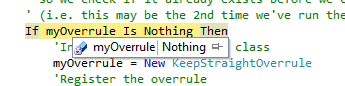
To display variable values, you can also right click on the variable in your code and select Add Watch. This displays the variable and its value in the Watch window at the bottom of your IDE.
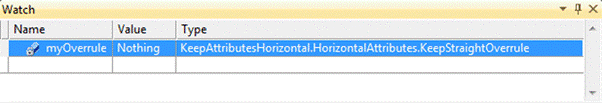
The debugger is telling you that the value of myOverrule is currently Nothing. That’s not surprising because it’s the first time you’ve run this function. Based on the information the debugger has told you, will the code inside the If statement be executed or not?
That’s right – it will – because myOverrule Is Nothing is True.
Keep stepping through the code, hovering over variable values and properties to see how they change as the code executes. If at any point you want to stop line-by-line debugging, just hit F5 to Continue to the next breakpoint you set – do this when you reach the end of the ImplementOverrule() method.
Now you’ve finished stepping through your custom command, it’s time to debug your overrule. If AutoCAD hasn’t automatically become active, click its icon in your taskbar. Type ROTATE followed by <Enter> on the command-line, select one of the block inserts in the drawing, and then select a base-point for the rotation.
As soon as you’ve selected the base-point, the debugger should hit the breakpoint for your overridden TransformBy method. Step through this code checking variable values as you go:
· Notice the value of the entity parameter variable that is passed in to the function. The debugger is reporting its type as AttributeReference – a variable of type Entity is holding an object of type AttributeReference. Remember what you learned about inheritance and casting in Lesson 3.
· Hover your mouse over the transform parameter variable. Click on the + sign to the left of the variable value in the tooltip to expand it. This allows you to query the public properties of this Matrix3d class instance – which tell you the values for each element of the matrix, as well as the coordinate system the matrix represents. (Don’t worry if you don’t understand matrix geometry – the point is that you can view the properties of variable objects in the debugger.)
· Check the value of the attRef.Rotation property just before and after you execute that line of code.
If you hit F5 now, you’ll find that AutoCAD immediately calls TransformBy() again. This is because AutoCAD is jigging the entity – it’s transforming your block insert every time you move your mouse. Click on the line where you added the breakpoint for the TransformBy() function and hit F9 to turn it off. Hit F5 again and the debugger will stop interrupting AutoCAD. Finish the ROTATE command by clicking in the drawing window to select a rotation angle.
Finally, invoke the KEEPSTRAIGHT command again. Check the value of myOverrule at the start of the If statement, and see how the debugger takes a different path through your code the second time you run that method.
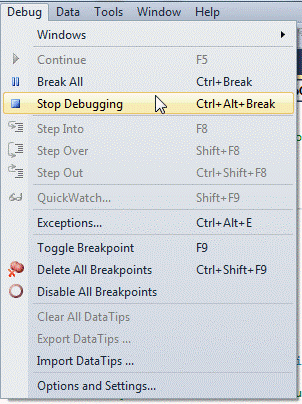
Once you’ve finished experimenting, select Stop Debugging from the Debug menu to close AutoCAD and end your debugging session.
Congratulations! You now know how to debug a project in Visual Studio Community.
Optional Exercise
To experiment further with debugging, create a new plug-in project and paste the code below into MyComamnds.vb. The code is based on (although not identical to) the examples used in Lesson 3 to demonstrate object-oriented programming concepts. Call the new project ObjectOrientedSample.
· Set a breakpoint at the start of the Test() method;
· Launch AutoCAD from the debugger;
· NETLOAD ObjectOrientedSample.dll from the bin\debug project subfolder
· Invoke the RUNTEST command at the AutoCAD command -line, then use the debugging operations you learned in this lesson to study the code execution and variable values.
Here is the code:
Imports Autodesk.AutoCAD.Runtime
Namespace ObjectOrientedSample
    Public Class MyCommands
        <CommandMethod("RunTest")>
        Public Sub Test()
            Dim pt1 As Point = New Point
            ' USe Step Into on the next line to step into SetLocation
            pt1.SetLocation(10, 10)
            Dim xVal1 As Integer = pt1.X
            pt1.X = 9
            Dim xVal2 As Integer = pt1.X
            Dim pt2 As NewPoint = New NewPoint
            ' SetLocation, X and Y are inherited from Point class
            pt2.SetLocation(20, 20)
            Dim xVal3 As Integer = pt2.X
            pt2.X = 9
            ' Z is new to the NewPoint class
            pt2.Z = 12
            Dim pt3 As Point = pt2
            ' pt3 is variable of type Point, but holds an object of type NewPoint
        End Sub
    End Class
    Public Class Point
        Private mXCoord As Integer
        Private mYCoord As Integer
        Public Sub SetLocation(ByVal x As Integer, ByVal y As Integer)
            Me.mXCoord = x
            Me.mYCoord = y
        End Sub
        Public Property X() As Integer
            Get
                Return Me.mXCoord
            End Get
            Set(ByVal value As Integer)
                Me.mXCoord = value
            End Set
        End Property
        Public Property Y() As Integer
            Get
                Return Me.mYCoord
            End Get
            Set(ByVal value As Integer)
                Me.mYCoord = value
            End Set
        End Property
    End Class
    Public Class NewPoint
        Inherits Point
        Private mZCoord As Integer
        Public Property Z() As Integer
            Get
                Return Me.mZCoord
            End Get
            Set(ByVal value As Integer)
                ' Don't accept negative Z values
                If value >= 0 Then
                    Me.mZCoord = value
                End If
            End Set
        End Property
    End Class
End Namespace
Was this information helpful?
The Assistant can help you find answers or contact an agent.
What level of support do you have?
Different subscription plans provide distinct categories of support. Find out the level of support for your plan.