Issue:
When creating a contour plot of a result, what is meant by "Data Conversion", "Data Type", and "Contour Type"? This applies to Inventor Nastran and Nastran In-CAD.
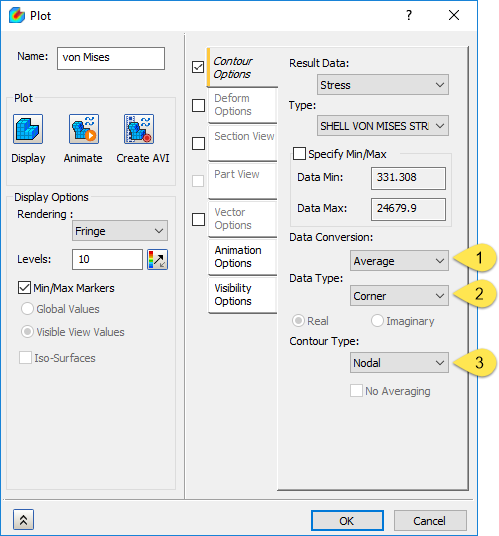
Figure 1: The Plot options in the drop-downs are as follows:
- Data Conversion: "Average", "Maximum", or "Minimum"
- Data Type: "Corner" or "Centroidal"
- Contour Type: "Nodal", "Elemental" with averaging ("No Averaging" unchecked), or "Elemental" without averaging ("No Averaging" checked)
Causes:
Some types of results have multiple results calculated at the same node. Some types of results have results calculated at different locations throughout the element. How the multiple calculated results are displayed is controlled by the three selections.
Solution:
Data Type:
When a result has values at the nodes and centroid, the data type lets you select which result to use for the contour plot. If the result only exists at one location, both options behave the same.
- "Corner" = use the calculated results from the nodes.
- "Centroidal" = use the calculated results from the centroid of the elements.
Data Conversion:
When multiple calculated results are available, the Data Conversion lets you choose how to combine the result to use in the display. If there is only one result, all options behave the same.
- "Average" = use the average of all results from the location.
- "Maximum" = use the largest of all results from the location.
- "Minimum" = use the smallest of all results from the location.
Contour Type:
Now that the result values are selected, you can choose
where to display them on the model. The contour plot then smooths the colors between the values shown at the chosen location.
- "Nodal" = display the result value at the nodes. In most cases, you want to display the nodal results (the corners) at the nodes.
- "Elemental" and "No Averaging" is checked = display the result value over the entire element.
- "Elemental" and "No Averaging" is unchecked. This option gives the same result as “Nodal”.
Background:
- Some types of results have a single value at a node. Displacement results are an example. All elements connected to the node have the same amount of displacement.
- Some types of results have multiple values at a node. Stress results are an example. The displacement of the element creates a different stress at each node on the element. Because each element displaces differently, the calculated stress in the element at a common node can be different in each element.
- Nastran also calculates a stress result at the centroid of the element.
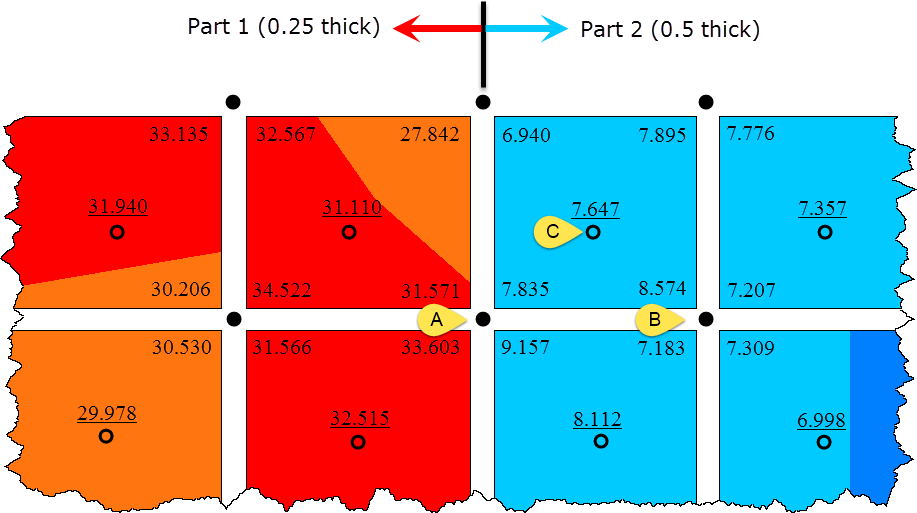
- If you could view the stress results without any manipulation (that is, look at the "raw" results or "unsmoothed" results), they would look like the following image. In this image, the elements are separated to help visualize that the results at a common node are different, and the stress at the centroid is underlined.
Figure 2: Example results.
- The difference in the stress result at a node from one element to the next element changes as follows:
- When in the same part, the stress should change very little when the mesh is sufficiently fine. If the stress changes by a large magnitude, the mesh size needs to be smaller.
- When in different parts, the stress can change. The above example shows a step-change in the stress due to the change in thickness of the shell elements.
- When viewing the contour or probing on the results, the value displayed is controlled by the options chosen for the "Data Conversion", "Data Type", and "Contour Type".
Examples:
Using the raw stresses from the figure above, some common settings and example results are as follows:
Average stress at a node, smoothed across part boundariesThe raw nodal stresses from all elements in all parts attached to the node are averaged to create one value. The average value is shown at the node.
| Data Conversion | Data Type | Contour Type | No Averaging | Examples (see figure above) |
|---|
| Average | Corner | Nodal | - | 20.542 at A = (31.571+7.835+9.157+33.603)/4
7.568 at B = (8.574+7.207+7.309+7.183)/4 |
Raw stress at centroidThe raw stress from the center of the element is displayed over the entire element.
| Data Conversion | Data Type | Contour Type | No Averaging | Examples (see figure above) |
|---|
| Average | Centroidal | Elemental | Checked (results not averaged) | 7.647 at C |
More extensive examples are in the attached document "Understanding Data Conversion.pdf".
- Depending on the result (displacement, stress, safety factor, etc.), some combinations of the options from the three drop-downs produce the same result. Which combinations provide different results and which provide the same result can be difficult to know.
- It is not possible to display the raw stress values from the element corners.
- It is not possible to display the average nodal stress without averaging across the part. This can be critical where the stress has a step-change due to differences in each part.
Products:
Inventor Nastran;